调试与检查
快速定位布局、命中、渲染和性能问题:一行 overlay、一个独立面板、一个有界的结构化 Console。
窗口内检查器
开发阶段在根节点上附加 overlay。悬停时它用虚线框标出节点矩形,并显示尺寸与组件名;overlay 自身是 pass-through 的,不拦截点击和滚动,悬停时也只做绘制级更新,不触发重新布局。
fn mountUi(cx: *ui.Cx, scope: *ui.Scope) anyerror!*ui.Node {
    const root = try mountProductUi(cx, scope);

    // Development only: hover highlight with size + component name.
    _ = try ui.devtools.overlay.attach(cx, scope, root, .{});
    return root;
}
overlay 的状态挂在传入的 scope 上,Scope 释放时 overlay 随之移除。它适合在产品窗口里快速确认「谁占了这块空间」;完整诊断用独立面板。两者都读取真实的 Node / Cx 状态,不需要为调试再维护一份镜像模型。
按现象排查
hit_behaviorsetText / setTextContent;这两个 API 自己会比较并标记 sizing / render dirtynode.style 不会标脏;用 node.setStyle(alloc, .width, v),它按字段选择正确的 dirty 级别独立面板
需要 Elements、Components、Console 与 Performance 完整视图时,用 ui.devtools.mountPanel(cx, target, opts)。面板有自己的 Cx,观察另一个 target Cx;推荐用 MultiWindowApp 把它放在独立窗口,不遮挡产品 UI。面板使用期间 target 必须保持存活。
const std = @import("std");
const ui = @import("ui");
const zenit_app = @import("zenit_app");

// mountProductUi: your app's ordinary mount function (see above).
var g_target_cx: ?*ui.Cx = null;

fn mountDevTools(cx: *ui.Cx, scope: *ui.Scope) anyerror!*ui.Node {
    _ = scope;
    const target = g_target_cx orelse return error.TargetNotReady;
    return ui.devtools.mountPanel(cx, target, .{ .title = "My App DevTools" });
}

pub fn main() !void {
    var gpa = std.heap.GeneralPurposeAllocator(.{}){};
    defer _ = gpa.deinit();

    var application = zenit_app.MultiWindowApp.init(gpa.allocator(), .{});
    defer application.deinit();

    const product = try application.createWindowWith(.{
        .window = .{ .width = 900, .height = 640, .title = "My App" },
    }, mountProductUi);
    g_target_cx = product.cx;

    const tools = try application.createWindowWith(.{
        .window = .{ .width = 760, .height = 560, .title = "DevTools" },
    }, mountDevTools);
    _ = ui.devtools.setViewMode(tools.cx, "performance"); // optional start tab

    try application.run();
}
这就是仓库 zig build devtools-probe 的结构。ui.devtools 还提供 setViewMode、setTreeFilter、setConsoleFilter 等函数,供探针和 E2E 以编程方式操作面板。
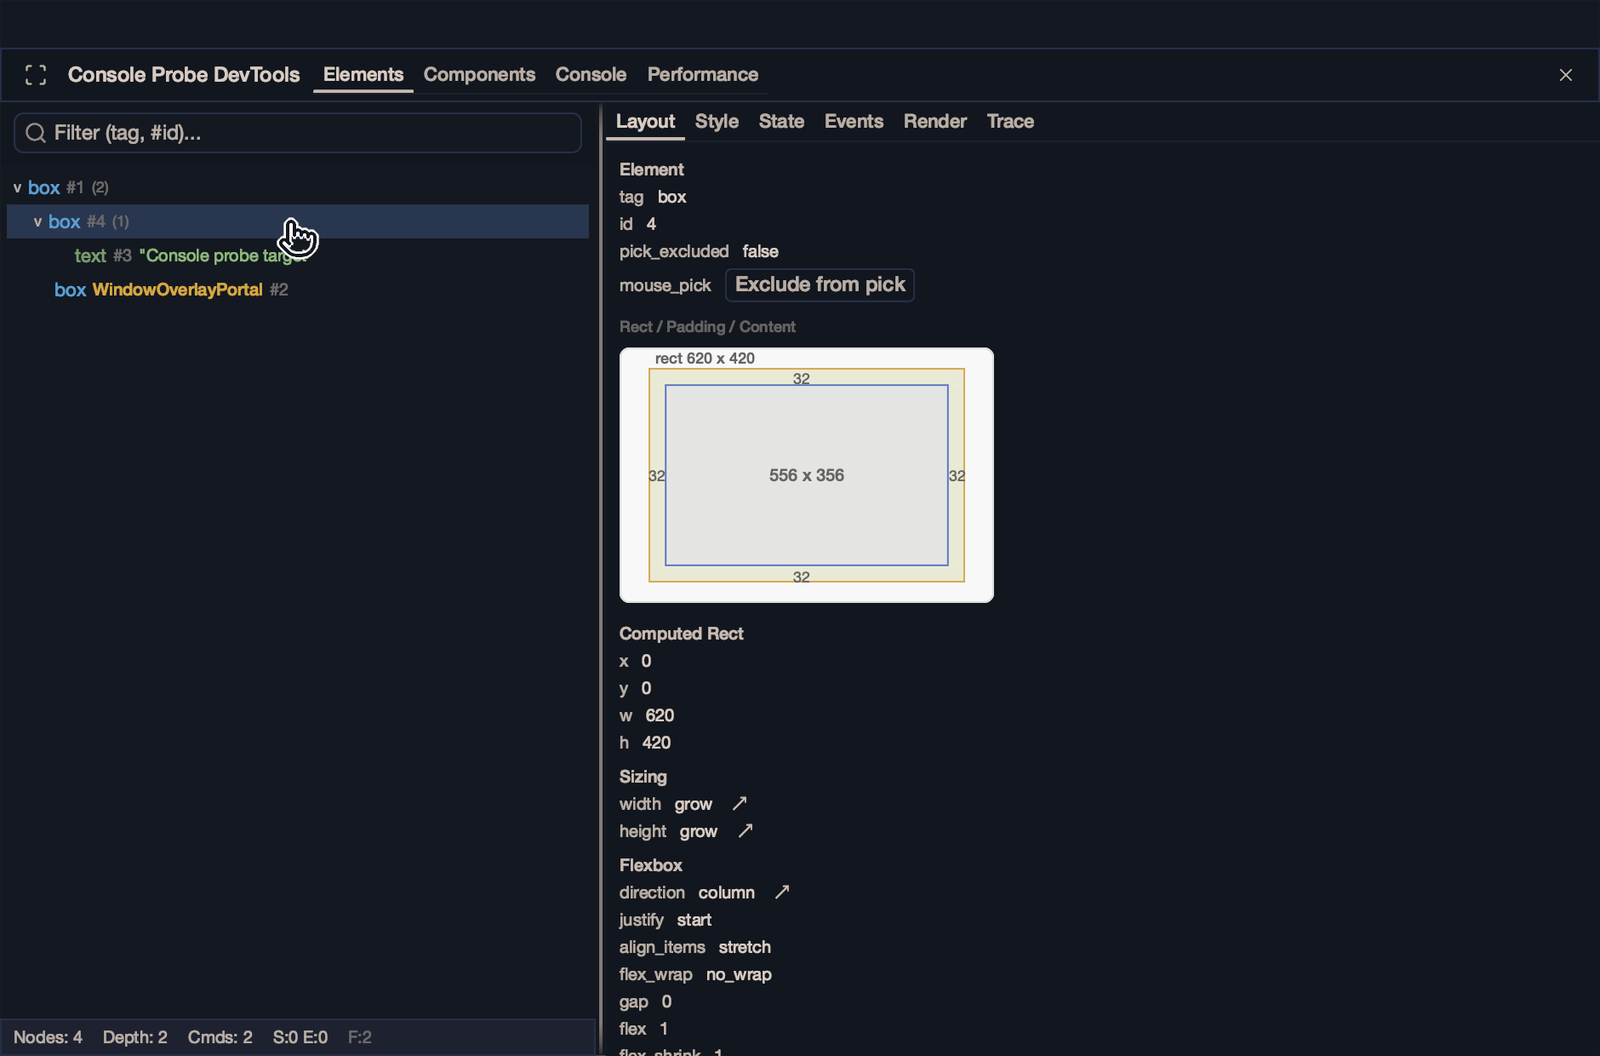
四个顶层视图,六个详情页
选中 Elements / Components 中的行后,可在 Layout、Style、State、Events、Render、Trace 之间切换。Style 中的部分数值可以实时编辑;Render / Trace 用于确认 dirty 原因和最近事件。树搜索支持 tag、#id 与组件名。配置 ui.devtools.source_link 后,组件行可以直接在编辑器中打开定义处。
Console 日志
每个 ui.Cx 都有自己的线程安全、有容量上限的 Console。同一条日志可以写到终端,同时保留为结构化事件,供 DevTools 和 E2E harness 读取;面板打开之前采集的历史也会显示。
const log = cx.console();

log.info("application ready", .{});
log.scoped("network").warn("retry {d}", .{attempt});

// Plain level methods don't record a call site; writeAt does.
log.writeAt(.err, @src(), "save failed: {s}", .{@errorName(err)});
等级依次为 debug、log、info、warn、err。此外还有与浏览器 Console 对应的 group / groupEnd、count、time / timeEnd、assert、trace、inspect 与 table。
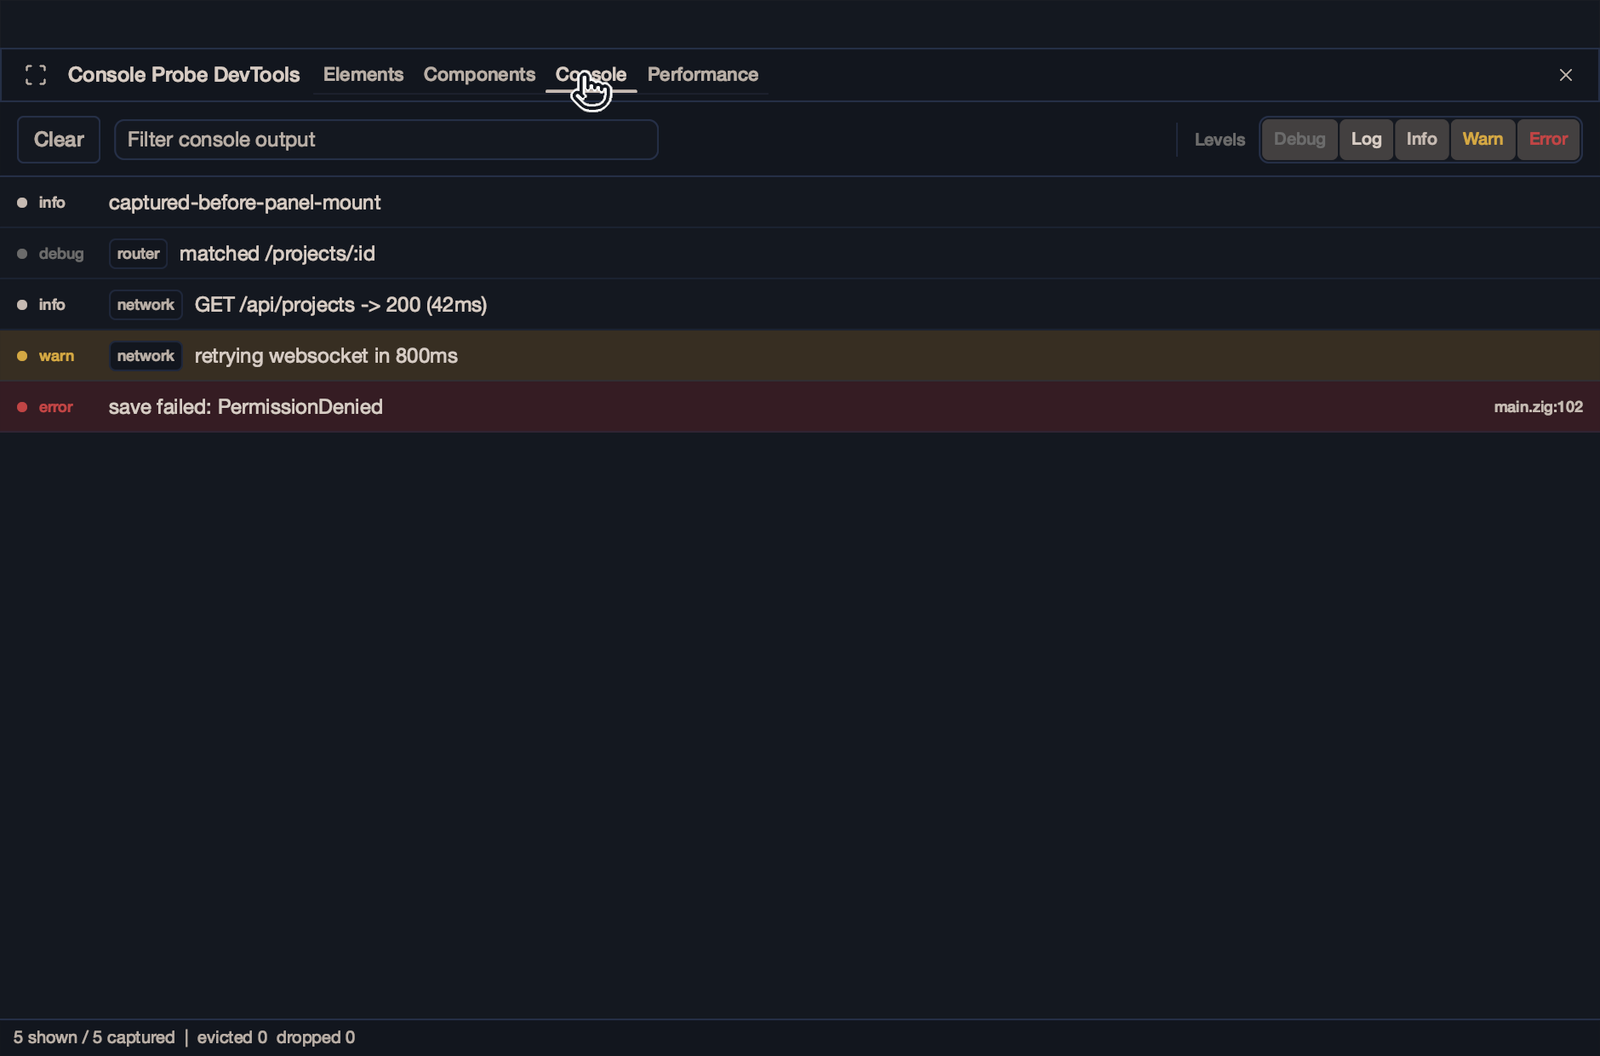
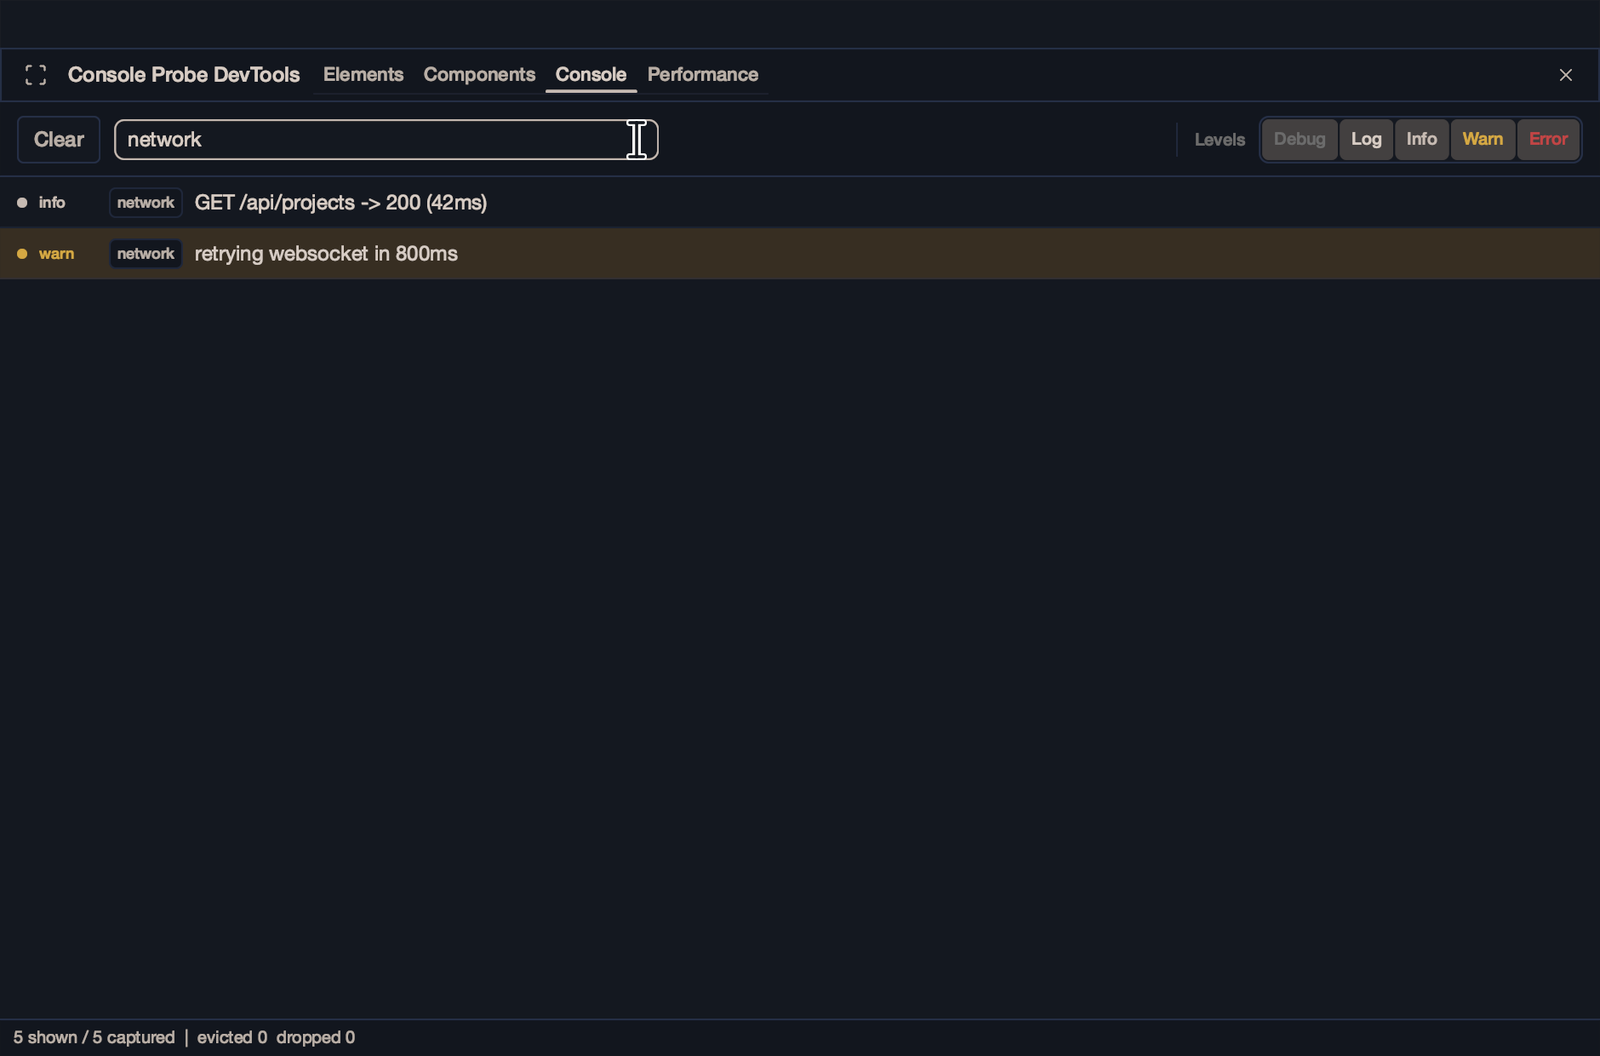
普通等级方法不记录调用位置。想点击日志跳到编辑器,使用 writeAt(level, @src(), …),并用 ui.devtools.source_link.configure 设置源码根目录与编辑器命令(默认 code --goto)。
配置采集
const app = try zenit_app.App.init(allocator, .{
    .console = .{
        .terminal_level = .info, // null disables the terminal sink
        .capture_level = .debug, // null disables in-memory capture
        .max_entries = 10_000,
        .max_bytes = 8 * 1024 * 1024,
        .max_entry_bytes = 64 * 1024,
    },
});
不传 console 时,zenit_app 按构建模式选择默认值:
Debug.debug.debugReleaseSafe.info.infoReleaseFast / ReleaseSmall.warnnull(关闭)Console 对齐的是浏览器 Console 的日志采集与查看能力,不是 Zig / JavaScript REPL。Group 目前只提供缩进、不可交互折叠;table 目前以文本形式输出。完整 API、线程与生命周期约束及 harness 示例见仓库的 docs/CONSOLE.md。
Performance:区分空闲与卡住
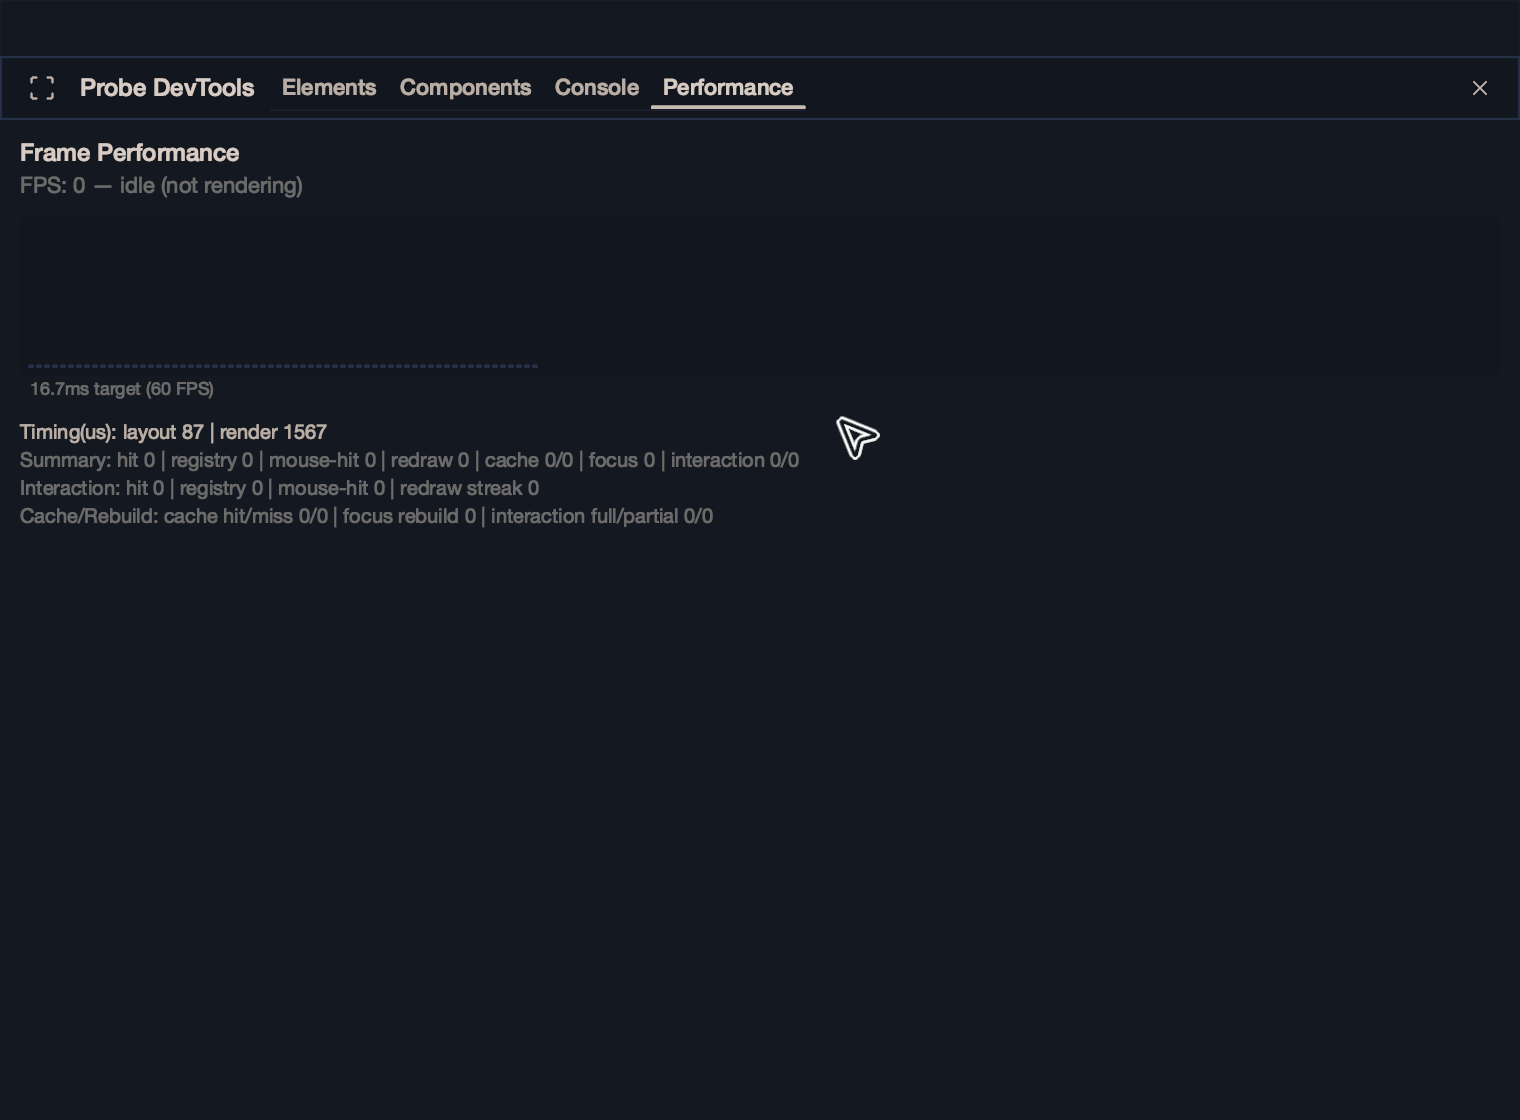
Performance 页不是截取「最近 N 个渲染帧」然后冻结。它按 100ms 的墙钟时间桶持续观察 target:共 64 个桶,约 6.4 秒的滚动窗口;FPS 取最近 10 个桶(约 1 秒)的平均。target 超过 0.7 秒没有新帧时,读数明确显示 FPS: 0 — idle (not rendering):这是框架有意的省电停帧,不是 0 FPS 卡顿。
测试入口
zig build test-headless
zig build test-ui
zig build test-render
zig build hello-button发布前检查
- ✓
关闭调试 UI。移除 inspector overlay,或用 debug 配置控制它只在开发构建中挂载。
- ✓
在真实窗口里验证输入。键盘、IME、剪贴板与 VoiceOver。
- ✓
跑构建门禁。headless、UI 与 render 相关的测试 step。
- ✓
确认 Console 策略。Release 的终端等级与采集开关符合预期,日志里没有敏感数据。
- ✓
固定版本。锁定 Zenit revision,并记录目标 Zig 版本。